
Note: Please check your Spam or Junk folder, in case you didn't receive the email with verification code.
Non-Linear: Random Order
At the end of this program
You will be able to
At the end of this program
Learners will be able to define Data Analytics and articulate its importance in various industries.
Learners will be able to outline and explain the key phases of the Data Analytics process, including data collection, cleaning, exploration, analysis, and visualization.
Learners will demonstrate an understanding of how data-driven decision-making is applied in real-world scenarios.
Learners will be able to identify and describe the responsibilities and skill sets required for various data-centric roles.
Learners will be able to compare and contrast the focus areas and tools used by Data Engineers, Data Analysts, Data Scientists, Business Analysts, and BI Analysts.
Learners will be able to determine which data role aligns best with specific business or organizational needs.
Learners will demonstrate the ability to collect data from diverse sources for analysis.
Learners will be able to perform data wrangling tasks such as cleaning, transforming, and organizing datasets.
Learners will gain foundational knowledge in data mining techniques to uncover patterns and trends and use visualization tools to represent data insights effectively through charts, dashboards, and reports.
.
 Concept of Data Analytics
 Role of a Data Analyst
 Classification of Data Structured, Semi-Structured, Unstructured
 Scale of Measurement of Data
 Various Data Sources and Modern Data Collection Methods
 Ref:What is Data Analytics
Duration:
 Unit1 Test
10 Questions
 Data Presentation and Visualization
 Types of Diagrams in Data Visualization
 Descriptive Statistics
 Univariate, Bivariate, and Multivariate Analysis
 Ref:Data Visualization
Duration:
 Unit2 Test
10 Questions
 Overview of SPSS Menus and Interface
 Creating and Managing Data Files in SPSS
 Importing and Exporting Files in SPSS (Excel, CSV, etc.)
 Variables and Labels in SPSS
 Selecting Cases, Filtering, Recoding Data, and Merging Files in SPSS
 Ref: Data Analysis
Duration:
 Unit3 Test
10 Questions
 Data Visualization using Frequency Tables and Charts
 Descriptive Statistics and Cross-Tabulations
 Compare-Means, ANOVA, Independent Sample t-Test, Paired Sample t-Test, One-Way ANOVA, and Chi-Square Tests
 Simple and Partial Correlation
 General Linear Model (GLM)
 Exploratory Data Analysis
Duration:
 Unit4 Test
10 Questions
 R Installation, Loading, and Using Packages
 Data Types and Structures in R Vectors, Matrices, Lists, Factors, and Data Frames
 Conditional Statements, Loops, Functions, and Apply Family in R
 Data Import in R CSV Files, Web Data, and Excel Files
 Handling Missing Values and Outliers in R
 Descriptive Statistics and Data Visualization in R
 Linear Regression Using R.
 R Programming
Duration:
 Unit5 Test
10 Questions
 Installation of Python Software
 Keywords, Identifiers, Comments, Indentation, and Statements in Python
 Data Structures and Types in Python
 String Operations in Python
 Input-Output Handling and Formatting in Python
 Operators and Control Flow in Python
 Functions in Python
 Python for Data analytics and Programming
Duration:
 Unit6 Test
10 Questions
 Introduction to Data Science using Python
 NumPy and Pandas for Data Manipulation
 Data Visualization in Python
 Exploratory Data Analysis (EDA) using Python
 Ref: Data analysis with Python
Duration:
 Unit7 Test
10 Questions
 Identifying an Industry or Business Problem
 Collecting and Analyzing Data
 Developing a Data-Driven Solution
 Creating a Business Case
 Presenting Findings to Industry Leaders and Faculty
 Business Data Analytics using Python
Duration:
 Unit8 Test
10 Questions
 Final Assessment
30 Questions
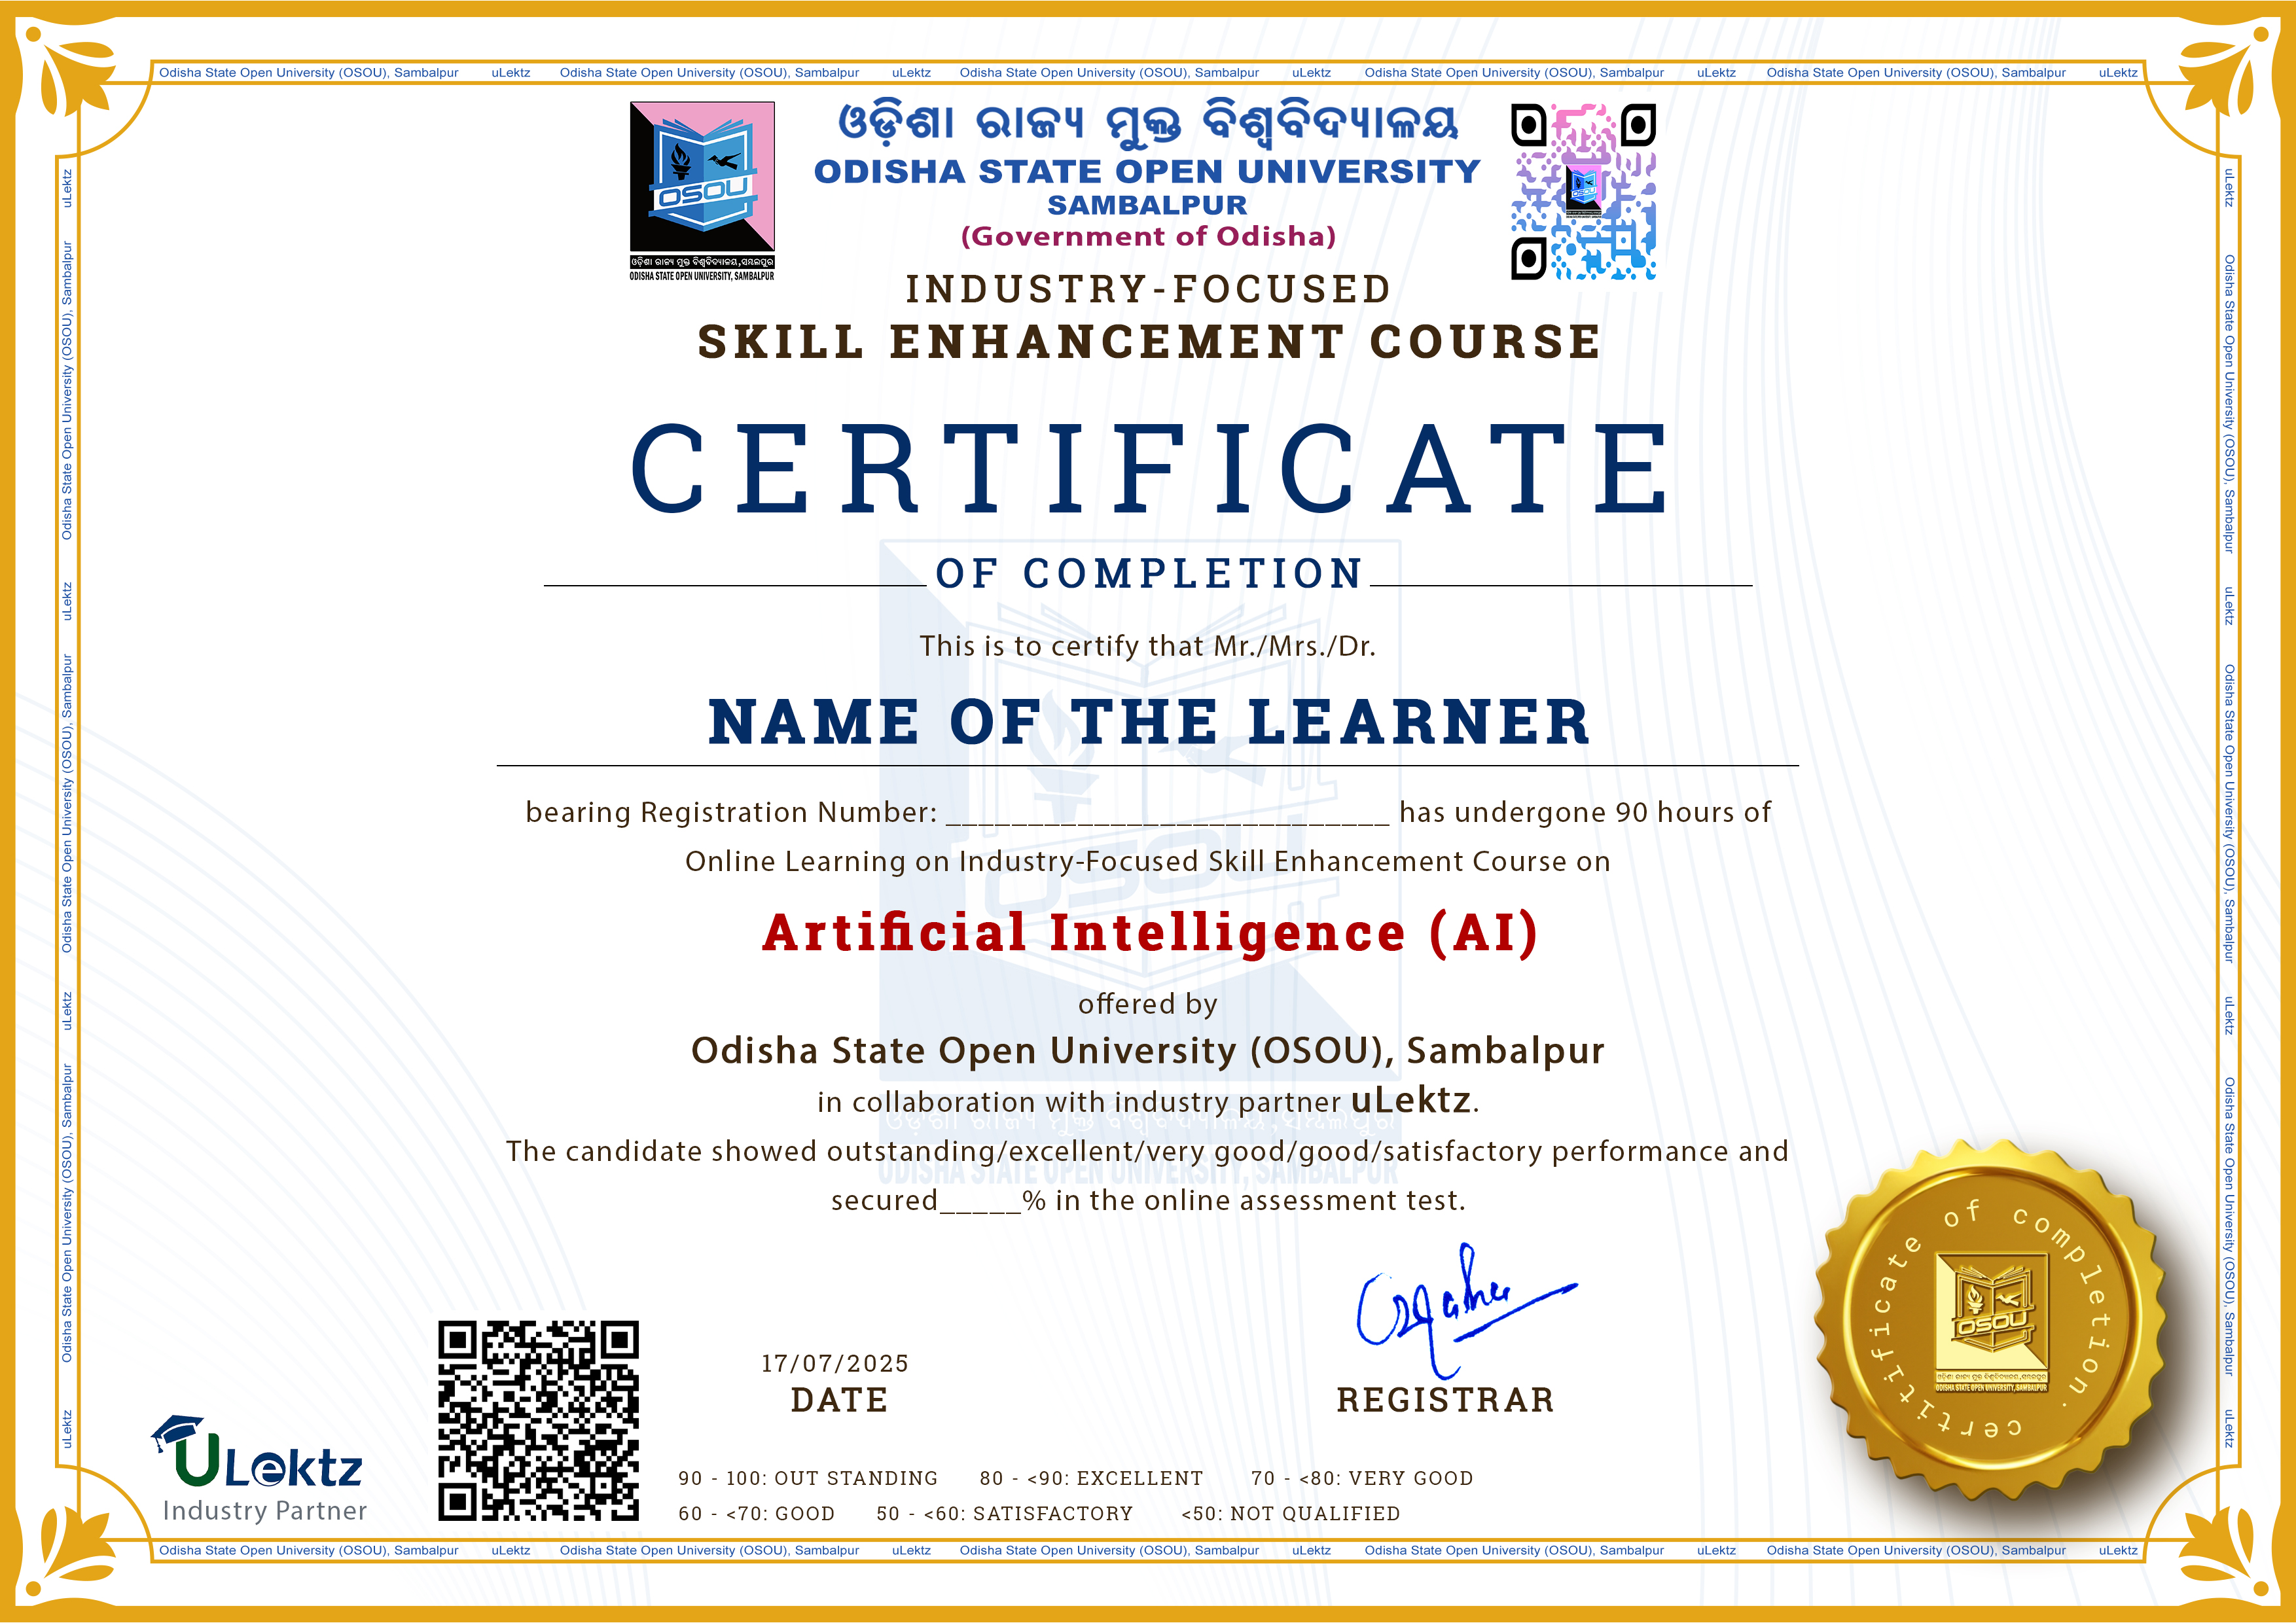
The certificate issued for the Course will have
Only the e-certificate will be made available. No Hard copies. The certificates issued by Odisha State Open University, Sambalpur. can be e-verifiable at www.ulektzskills.com/verify.


 90 hours Learning Content
 100% online Courses
 English Language
 Certifications